3.4 Long-Run Aggregate Supply (LRAS)
3 min read•december 30, 2022
J
Jeanne Stansak
H
Haseung Jun
J
Jeanne Stansak
H
Haseung Jun
AP Macroeconomics 💶
99 resourcesSee Units
Long-Run Aggregate Supply (LRAS)
Long-run aggregate supply is defined as the number of goods and services that an economy is capable of producing with the full employment of resources.
The relationship between the price level and Real GDP output supplied in the long-run is constant. As the price level rises or falls, firms will not alter the quantity of Real GDP output they produce.
In the long run, wages and resources prices are flexible. When price level increases, wages will increase by the same amount.
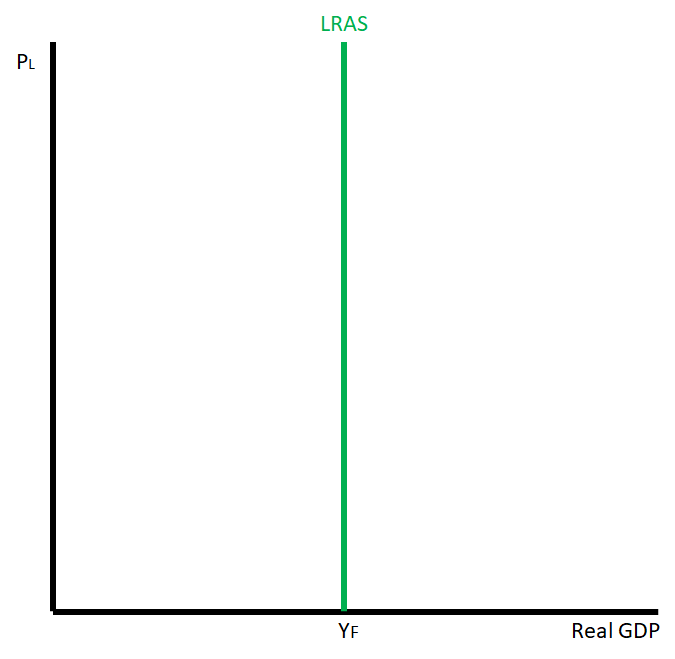
The long-run aggregate supply curve (LRAS) is vertical at full-employment. YF represents the quantity of output the society can produce when they are at full employment and at the natural rate of unemployment. The LRAS curve shifting to the right can correspond with the production possibility curve (PPC) because both of them represent production capacity. It can also refer to economic growth. Whenever LRAS shifting to the right is mentioned, you can automatically pair that with the PPC expanding outward and economic growth.

The LRAS shifts anytime a situation would cause the production possibilities curve to shift. The difference between a change in the SRAS and LRAS is that we are looking at changing the potential output of an economy with LRAS and not the actual output at the time, as we do with SRAS. The shifting of the LRAS happens when there is a change in:
- the number of resources (factors of production such as larger labor force 🦾, more capital 💻, more natural resources🌼)
- the quality of resources (factors of production such as better technology that increases productivity of labor 🦾 and capital 💻)
- policy (incentives or policies that works to increase employment)
Any of these factors can cause an increase in the potential output of an economy, which will shift the LRAS to the right, or a decrease in the potential output of an economy, which will shift the LRAS to the left.
If the LRAS Curve shifts left, an economy's capacity to produce decreases.
Shifters in LRAS
A change in the number of resources that could impact the LRAS includes a change in:
- the size of the workforce
- the number of land resources available
- capital stock
Some examples or scenarios in this category that could increase the LRAS include:
- a larger workforce, an increase in land resources
- an increase in capital stock
- a decrease in the size of the workforce or population
- depletion of land resources
- destruction of capital
A change in the quality of resources that could impact the LRAS includes:
- a better educated and more highly skilled workforce
- an improvement in the quality of land resources
- an improvement in the capital
When we see greater investment in schools and job training facilities, it allows us to have a workforce with more productive skills. When new technology is developed that makes certain resources more productive, we are able to increase our potential output.
Examples of this could include better ways to access our resources, such as items like fertilizer and chemical pesticides that lead to a greater yield of certain goods. When we develop technology to improve our capital resources than we also see an increase in LRAS. If the deterioration of a country's infrastructure or its educational system occurs, that can cause a decrease in potential output for the economy.
Also, when there are policy changes within an economy, we can change our potential output. A lot of times these policies are created within the different levels of government. For example, if the government enacts policies that provide large incentives to find a job, then we see an increase in the size of our workforce which in turn increases our LRAS. Another example could be the government giving tax incentives to invest in capital or technology, which also causes our potential output to increase.
Browse Study Guides By Unit
💸Unit 1 – Basic Economic Concepts
📈Unit 2 – Economic Indicators & the Business Cycle
💲Unit 3 – National Income & Price Determination
💰Unit 4 – Financial Sector
⚖️Unit 5 – Long-Run Consequences of Stabilization Policies
🏗Unit 6 – Open Economy - International Trade & Finance
📝Exam Skills: MCQ/FRQ

© 2025 Fiveable Inc. All rights reserved.