Unit 2 Overview: Economic Indicators and the Business Cycle
4 min read•june 18, 2024
AP Macroeconomics 💶
99 resourcesSee Units
Unit 2 Overview: Economic Indicators and the Business Cycle
Economic Indicators and the Business Cycle
So you’ve survived Economics Basics - yay! But, now what? In Unit 2, we will dive into all of the fancy numbers that economists use to explain the health of the economy. An understanding of these statistics - or as we call them - Economic Indicators - will make the financial report on the news make that much more sense.
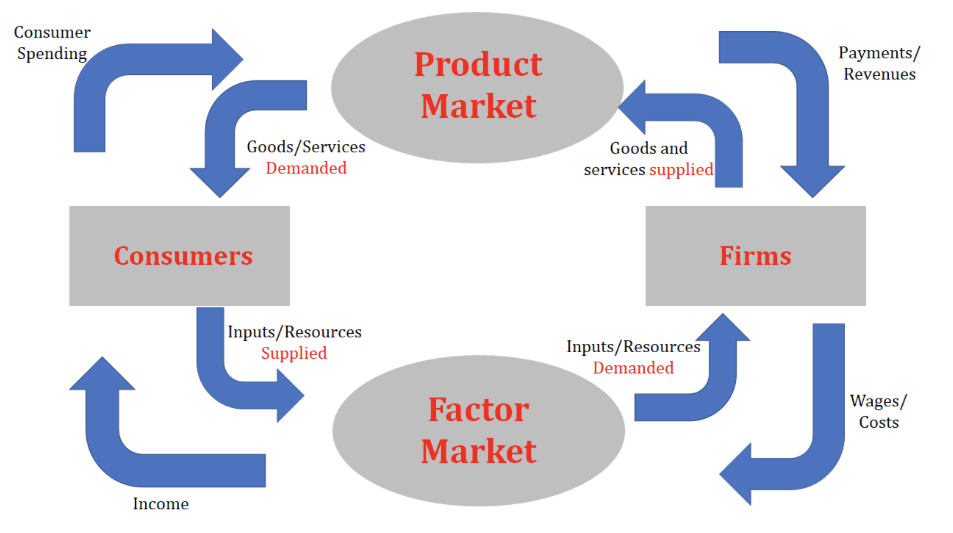
Before we get to the economic indicators, it is important for us to understand the flow of the economy - which just so happens to make a nice and easy circle ⭕. Aptly named the Circular Flow Model, this helps us track both the money (in the form of payments, spending, wages, and income) in our economy and the goods/services/resources in a simplified and understandable way. Of course, the economy has a lot more variables than are presented here, but the circular flow gives us an easy way to understand the basics. Notice money 💰 moves clockwise while goods/services 🛍 move counter clockwise!

From there we get to explore Gross Domestic Product (GDP) including what it is made up of, how it is calculated, and most importantly what it means. GDP gives us the opportunity to not only compare one economy to another but to see how our economy has changed over time. Of course, we don’t want to compare apples to oranges so we will need to take some time to understand inflation (the general rising of prices or when you feel like your money is worthless) and how we can use that to adjust GDP and make our comparisons more accurate. Inflation is calculated by keeping track of the prices of goods and services in an imaginary shopping cart 🛒 (this is called the Consumer Price Index). It includes items as inexpensive as bread 🍞 and eggs 🥚 but also includes bigger consumer purchases like cars 🚗 and computers 💻. Both the official GDP and inflation rate are calculated by some very well-paid economists and statisticians at the Bureau of Labor Statistics. Comparing GDP to a base year is known as Real GDP (accounting for inflation), while your basic GDP calculation is referred to as Nominal GDP.
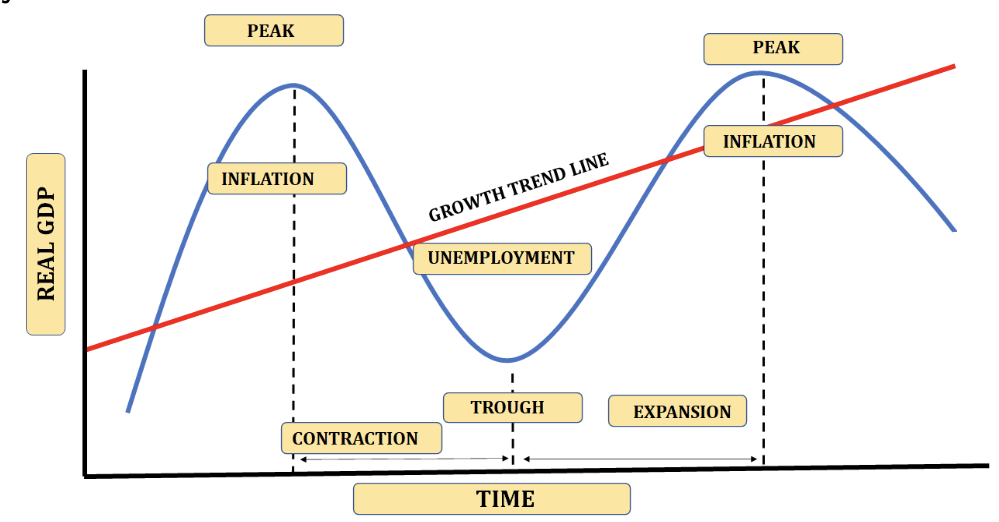
This all begs the question - how do we know the economy needs improving? As we are learning there are a lot of indicators to give us insight into the health of the economy. But, did you know that the economy tends to move in a cycle? The Business Cycle is our simplified model of how the economy tends to move. For you math and science nerds, it looks like a sine curve or sound waves, moving up and down over time. From its peak 🏔 (the highest point) our cycle contracts down to a trough 🐷 (the lowest point) and then expands back up to another peak. It happens over and over. Bonus points if you noticed this cycle of boom and bust in the US Economy as APUSH students!
GDP is made up of four components (consumer spending, government spending, investment spending, and net exports) and is directly linked to the aggregate demand we will study in the next unit. With a simple formula based on expenditures (C + I + G + Nx), you too will be able to play around with GDP. This will put you in a great place to make fiscal policy decisions (you might even do a better job than Congress💀). But in all seriousness, we’ll learn more about Fiscal Policy in our next Unit and then you’ll be able to write strongly worded letters 📩 to your local representatives with suggestions on how to improve the economy 🤑. Note: GDP can also be calculated through the income approach, but it is super complicated and unnecessary for us armchair economists (that being said you should know that it exists for your AP Exam).

We’ve got all of our circles and cycles down, and we understand GDP and Inflation, but what about Unemployment? This is the economic indicator that we hear about the most, but likely don’t understand. We will cover who is in the labor force and who isn’t. We will learn that some unemployment is actually quite natural, and we will learn about the good and bad types of unemployment. For example, being unemployed because you just moved across the country (frictional) to attend the college of your dreams is actually not a bad thing! On the other hand, losing your job because you don’t have the skills to keep up with new technology is not great (structural). But, at the end of the day, as long as you aren’t unemployed because the economy is in the toilet (cyclical), you’re probably going to be ok!
That was a lot - so let’s recap! There’s a circular flow to see how things move through the economy and a business cycle to see how the economy moves up and down. There are a host of indicators including GDP (both nominal and real), the Consumer Price Index (to calculate inflation), and unemployment.
Browse Study Guides By Unit
💸Unit 1 – Basic Economic Concepts
📈Unit 2 – Economic Indicators & the Business Cycle
💲Unit 3 – National Income & Price Determination
💰Unit 4 – Financial Sector
⚖️Unit 5 – Long-Run Consequences of Stabilization Policies
🏗Unit 6 – Open Economy - International Trade & Finance
🤔Exam Skills
📚Study Tools

© 2024 Fiveable Inc. All rights reserved.